Diversification both geographically and in asset types is key, since there is no asset that consistently performs better than the rest.
Why diversify?
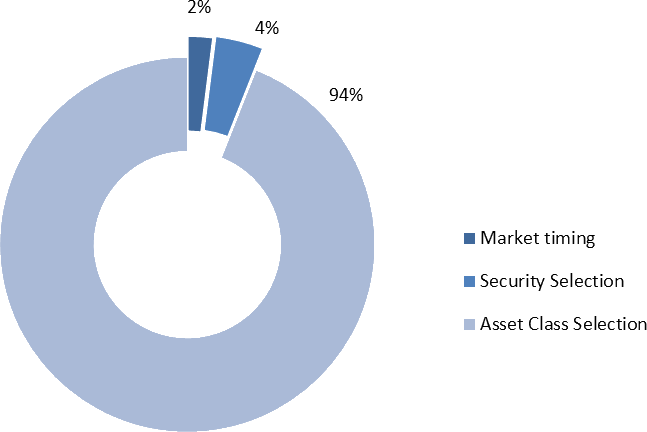
Throughout history, both in the academic world and in the financial industry, it has been confirmed that the correct selection of asset types is the most important factor in the performance of a portfolio. The chart below highlights the returns per year for each asset class.
Key Determinants of Portfolio Performance
In previous years, sophisticated investment solutions were offered only at the institutional level; however, solutions are currently available to the general public.
Globally, investors are turning away from financial products that offer limited investment opportunities and focusing on a global portfolio model.
Nowadays, anyone who wants to invest has access to the globally diversified portfolio solution.
Portfolio Models
The Portfolio Models are designed by Credicorp Capital. The purpose of this Portfolio Model is to offer results for the investor with efficiency, transparency, and profitability. The UCITS ETFs that have been selected are part of the Portfolio Model designed to meet specific objectives such as global diversification, tactical investments and tax efficiency. The platform guides each investor on how to invest and which are the most appropriate instruments for their profile. The asset selection process is based primarily on market exposure, tax efficiency and cost of the instrument, analyzing more than 300 UCITS ETFs.
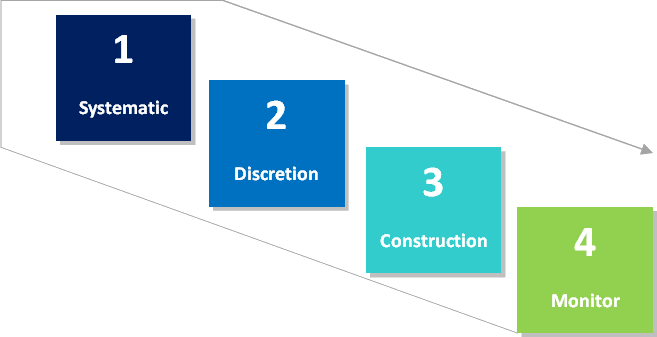
Process for building Credicorp Capital portfolios
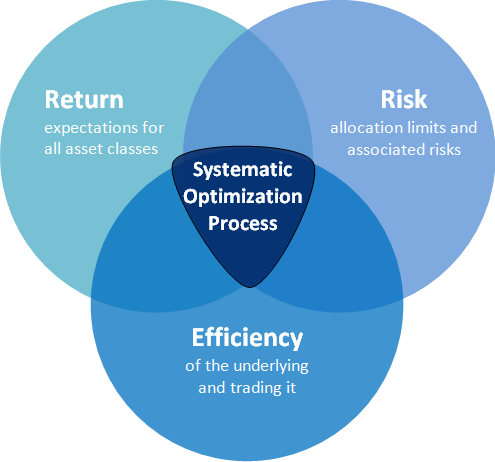
The variables in the optimization process are performance-risk-efficiency
The construction of the Credicorp Capital portfolios is a process based on the balance of returns and risks designed by our Portfolio Solutions team, which is divided into four stages.
How do we invest?
Methodology
Risk Profile
At the time of opening the account, a few questions are asked, our algorithms automatically recommend a Model Portfolio that is in accordance with risk tolerance, objectives and investment horizon. This information allows you to create an optimal portfolio of UCITS ETFs that adapts to your profile and financial objectives. Once the account is open, the client can switch to the different available portfolios as many times as they wish at no cost.
Investment Vehicles
To achieve global diversification, different financial assets are used, seeking to have the least possible correlation. This is why portfolios are made up of UCITS ETFs. Regularly, the universe of UCITS ETFs in the Model Portfolios is reviewed to identify the most appropriate ones to represent each of the asset classes. The Model Portfolios include the UCITS and ETFs that offer market liquidity, minimize tracking error and are tax efficient.
Asset Allocation
Based on the investment process and after an in-depth analysis of each financial asset, taking the Credicorp Capital guidelines for portfolio design as a guideline, the ideal composition is determined and thus achieve the highest possible return according to the risk profile defined by the investor. The goal is to create an asset allocation that produces the highest return possible, while respecting your particular risk tolerance. Translating investor outcomes and constraints into globally well-diversified allocations: Return - Risk - Cost.
Monitoring and Rebalancing
To keep the portfolios in line with long-term goals, they are constantly monitored and regularly rebalanced to maintain their original mix. This way the return is optimized according to the expected level of risk.
Why only UCITS ETFs?
UCITS ETFs are financial instruments registered in Europe that typically track an index, usually of stocks, bonds or other assets. UCITS ETFs are publicly traded and trade like stocks. UCITS ETFs provide excellent diversification, ample liquidity, transparency, and are tax efficient.
Defined Mandate
We only use UCITS ETFs that have a defined mandate to passively track the index it seeks to track. This restricts the administrator to only replicate the performance of the index that follows, thus achieving the same diversification.